Skip to article frontmatterSkip to article content
Site not loading correctly?

This may be due to an incorrect BASE_URL configuration. See the MyST Documentation for reference.

3.5 Cross-Covariance and Cross-Correlation

Cross-Covariance Definition

When examining the relationship between two time series, it is often useful to see how they move in tandem. One powerful tool for this is the cross-covariance function defined as

γx,y(s,t)=E[(xsμx,s)(ytμy,t)]\gamma_{x,y}(s,t) \stackrel{\triangle}{=}\mathbb{E}\big[(x_s-\mu_{x,s})(y_t-\mu_{y,t})\big]

for time series xsx_s and yty_t. Analogous to stationarity for autocovariance, the two series are said to be jointly stationary if both:

  1. xsx_s and yty_t are individually stationary.

  2. The cross-covariance is only a function of the lag h=sth=s-t.

In such a case, Eq. (1) can be simplified to

γx,y(h)=E[(xt+hμx)(ytμy)].\gamma_{x,y}(h) =\mathbb{E}\big[(x_{t+h}-\mu_{x})(y_t-\mu_{y})\big].

Since we are dealing with two distinct time series, it is generally the case that γx,y(h)γx,y(h)\gamma_{x,y}(h)\neq\gamma_{x,y}(-h) for h0h\neq0. This is due to the fact that γx,y(h)\gamma_{x,y}(h) represents the covariance between yy and xx at hh lags in the future, whereas γx,y(h)\gamma_{x,y}(-h) represents the covariance between yy and xx at hh lags in the past. Put differently, there is no reason to assume the covariance between employment and the following month’s inflation is the same as the covariance between employment and the preceding month’s inflation.

Cross-Correlation Definition

The cross-correlation function is defined as

ρx,y(s,t)=γx,y(s,t)γx(s,s)γy(t,t).\rho_{x,y}(s,t) \stackrel{\triangle}{=} \frac{\gamma_{x,y}(s,t)}{\sqrt{\gamma_x(s,s)\gamma_y(t,t)}}.

For jointly stationary time series, Eq. (3) simplifies to

ρx,y(h)=γx,y(h)γx(0)γy(0).\rho_{x,y}(h) = \frac{\gamma_{x,y}(h)}{\sqrt{\gamma_x(0)\gamma_y(0)}}.

Cross-Covariance and Cross-Correlation in statsmodels

In statsmodels, the cross-covariance and cross-correlation are accessed by statsmodels.tsa.stattools.ccovf and statsmodels.tsa.stattools.ccf, respectively. The only arguments we need to worry about at this point are x and y, the two time series. Note that these functions only calculate positive hh values, to get both positive and negative values (i.e. both x and y leading) you must run both ccf(x,y) and ccf(y,x).

Notional plot of cross-correlation function for two arbitrary time series consisting of phase shifted sine curves with noise. Note that in statsmodels it is necessary to calculate positive and negative h values separately.

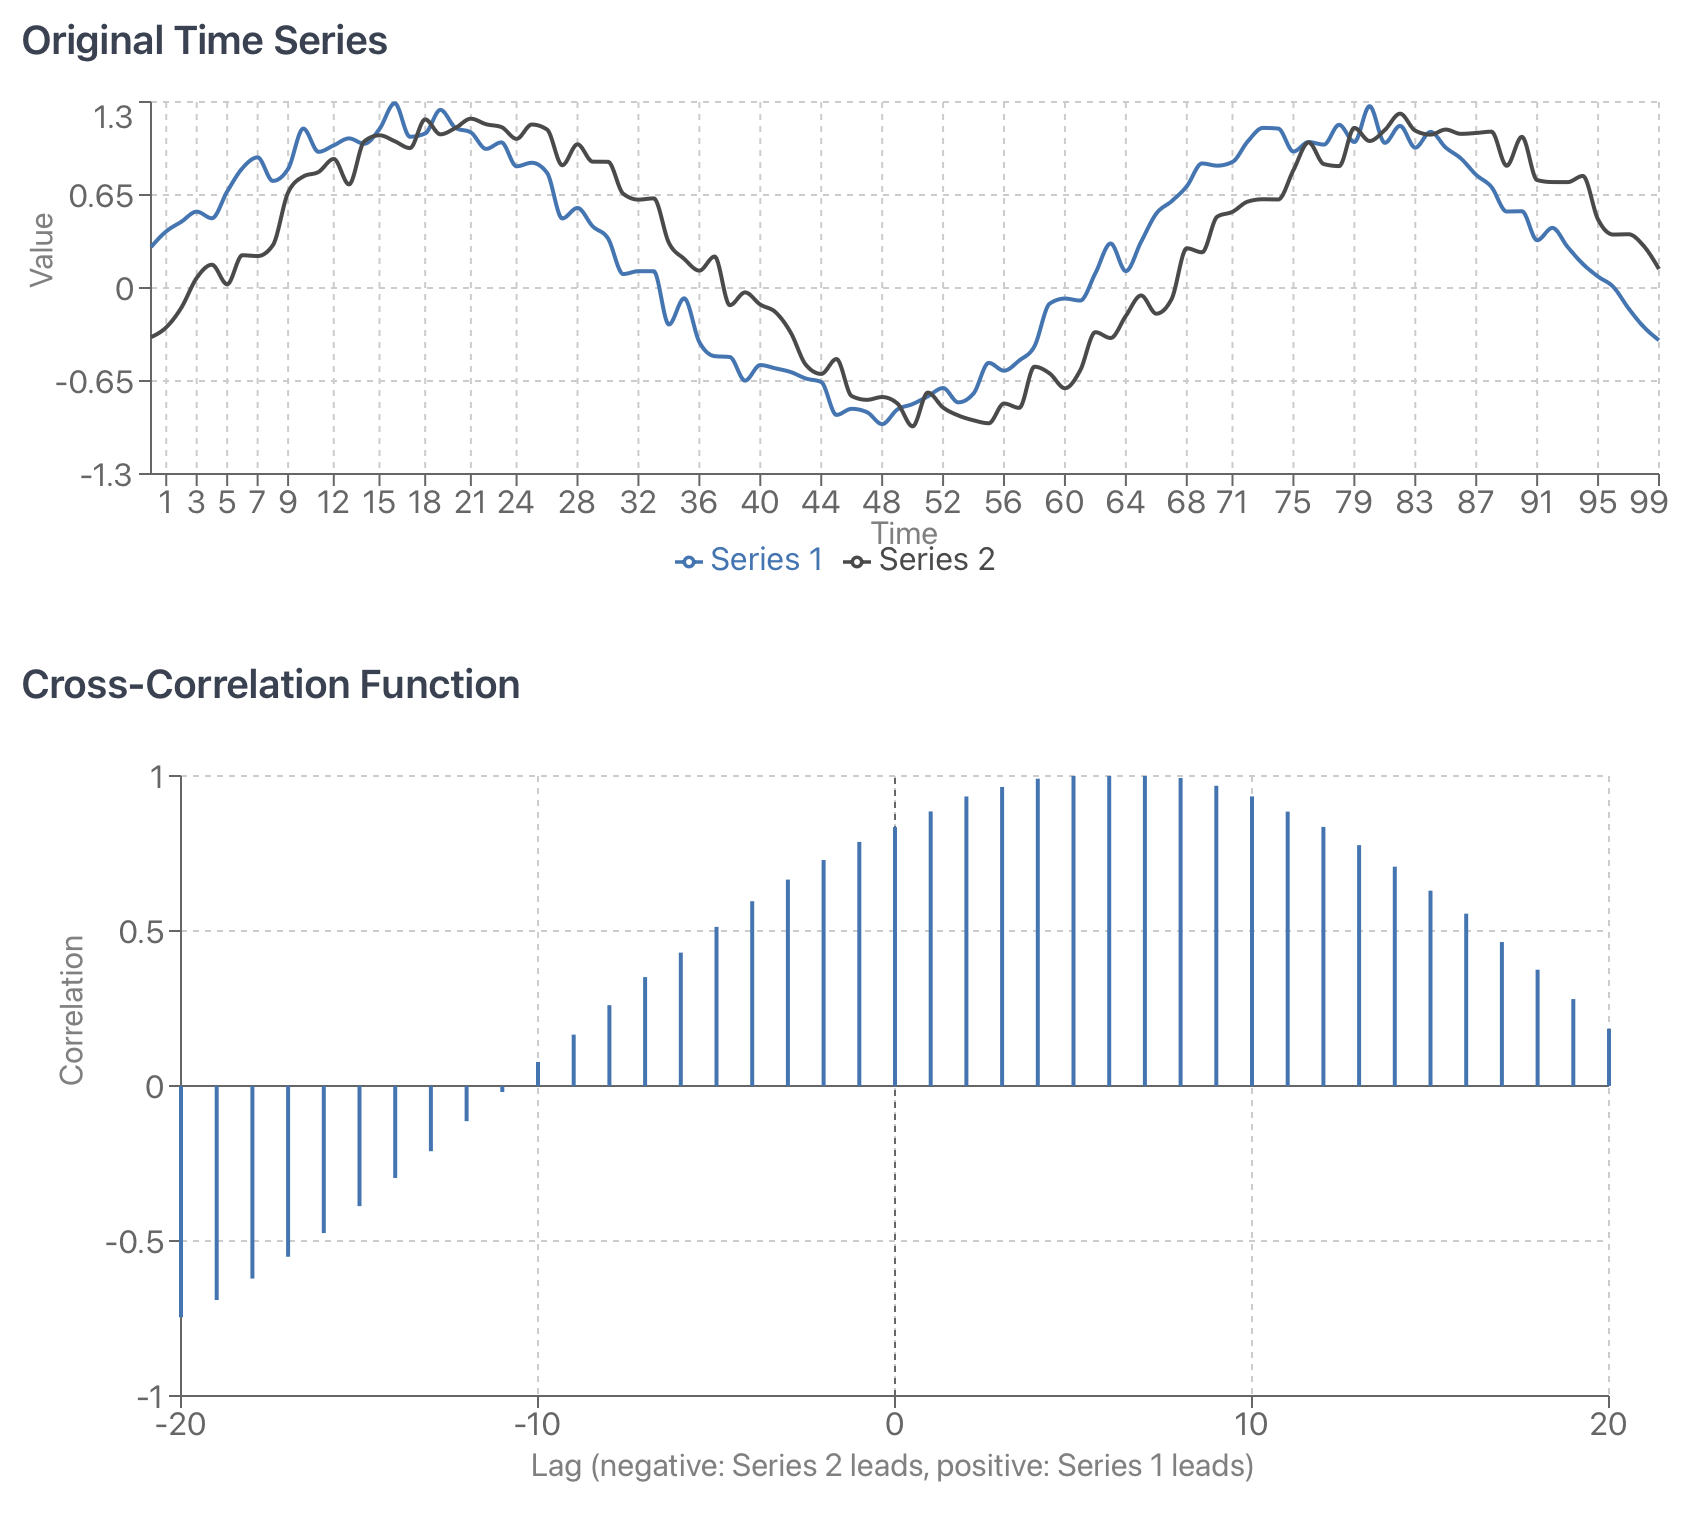
Figure 1:Notional plot of cross-correlation function for two arbitrary time series consisting of phase shifted sine curves with noise. Note that in statsmodels it is necessary to calculate positive and negative hh values separately.